


Summarize this content with artificial intelligence!

Power BI, data visualization and insights sharing enables data visualization and business intelligence tools. In fact, we can say that Power BI is among the most popular business intelligence tools on the market.
It transforms and makes data from different sources meaningful to create interactive dashboards and business intelligence reports. Power BI charts, tables, and maps help in collecting, analyzing, visualizing, and sharing data in various formats.
In fact, it wouldn't be wrong to split this entire process into data modeling and data visualization.
Data modeling alone is an ocean. 🌊 At this stage, various tasks such as data integration, table structures/relationships, data cleaning/enrichment are performed.
Ultimately, a set of data is accessed. It is very important that this data is accurate. To "play with" data specifically in Power BI, you need to know the scripting language called dax.
Let's move on to the next stage after obtaining the correct data. This time, you need to look in the right place. 🕵️
Data visualization comes into play precisely at this point. With the support of tools like Power BI, charts, tables, and reports are created at this stage using the datasets prepared during the data modeling phase.
In fact, you can think of this structure like the back-end / front-end distinction. You can specialize in one or master both.
Microsoft's Power BI can be a great choice, especially for Excel users, due to its similar interface and deep integrations with Excel.
Moreover, it offers advanced features that allow data transformation and cleaning. It is designed for both business analysts and non-technical users.
The platform also includes various applications:
- Power BI Desktop for creating reports
- Power BI Service for online sharing
- Power BI Mobile for connecting via mobile
Why Power BI?
There are multiple business intelligence tools in the market, so why do 97% use Power BI?
Its simple user interface allows users to create and visualize reports via a centralized mobile or desktop dashboard.
Machine learning tools for businesses that want to integrate machine learning tools into their workplaces provide access to a catalog of pre-trained but customizable machine learning models for users. These machine learning algorithms generate real-time results and actionable insights.
So, you see, Power BI is a feature-rich tool. Naturally, this makes it one of the best BI tools on the market. Let's take a look at its most popular features and advantages together. 👀
1. Access to Multiple Data Sources and Big Data Management
Power BI can access large amounts of data from multiple sources. It allows you to view, analyze, and visualize large amounts of data that cannot be opened in Excel.
Some of the important data sources available for use with Power BI include Excel, CSV, XML, JSON, and PDF. Power BI uses powerful compression algorithms to import and cache data in .PBIX files.
2. Interactive UI/UX Features
We mentioned that it makes visualizations both aesthetic and functional. Additionally, it allows users to easily use the tool with drag-and-drop features. Its user-friendly interface also helps in better understanding the data.
3. Integration with Excel
Power BI integrates seamlessly with Excel. Anyone familiar with Office 365 can easily connect Excel queries, data models, and reports to Power BI dashboards. Meanwhile, not only Excel, SQL Server, Azure and Salesforce can also integrate with cloud-based sources.
4. Accelerating Big Data Analytics with Azure
Power BI works in integration with Azure, speeding up the analysis of large volumes of data. Services like Azure Data Lake can reduce the time required to gain insights and increase collaboration between business analysts, data engineers, and data scientists.
5. Transitioning from Data to Action
Power BI enables the extraction of insights from data and the transformation of these insights into actions for making data-driven business decisions.
6. Real-Time Streaming Analytics
Power BI offers real-time data streaming support. It processes data from numerous sources like sensors and social media, enabling real-time analysis. This allows for instant business decisions.
7. Collaboration
If you want to share your dashboards and reports with others, Power BI allows it. This way, you can easily collaborate.
8. Advanced Use of R and Python
Power BI allows the creation of custom visuals using R and Python. Additionally, there are new AI capabilities like Copilot that help users generate insights from data using natural language queries.
Differences and Similarities Between Excel and Power BI
Power BI and Excel are often compared due to their many similar features.
Microsoft Excel has been on the market since 1985. Excel is widely used, especially in business and academic environments. On the other hand, Power BI has a history of less than 10 years and is certainly much less known. Nevertheless, it emerges as a good option in many scenarios.
Since both are developed by Microsoft, the two platforms integrate very well with each other. 🔗 A data model created in Excel can be easily published in Power BI without migration. Similarly, Excel and Power BI integrate seamlessly with other Microsoft Office applications like Teams and the Power ecosystem.
There is really no need to choose between Excel and Power BI because they work very well together. 🤝
However, if you have to make a comparison and speak generally, Excel is ideal for exploring data, while Power BI is more suitable for presentation and sharing.
The advantage of sharing and collaborating on dashboards and reports belongs to Power BI. All it takes is a few clicks.
You can also create visual reports with Excel, but you'll be limited by 1,048,576 rows. In Power BI, you can add a database as a source and create live reports. At this point, you need to use a special query language called data analysis expressions (dax).
In terms of interaction and functions, Microsoft Excel is more limited for dashboards. The table data format helps visualize data in different chart formats, but it is not an ideal tool for larger datasets.
Many of the features Power BI offers for formatting, natural language queries, editing, or filtering make reports easier to understand, visually appealing, and highly dynamic and interactive.
How to Use Power BI?
1. Downloading Power BI Desktop
Power BI Desktop is the main application used for designing and creating reports.
Before you start downloading Power BI Desktop, we have a small suggestion. 🤓 We recommend downloading Power BI Desktop from the Microsoft Store because it has several advantages:
- Windows automatically updates Power BI Desktop to the latest version. Since updates are released almost every month, this can save a lot of time.
- Instead of downloading the entire application for each update, Windows only downloads the components that have changed in the update. This eliminates long update times.
If you want to download the Power BI Desktop application directly, you can go to the product page and click the “Download Now” option.
Once all these download steps are completed, you can launch the application. When you open the application, Power BI appears on the screen with a blank report.
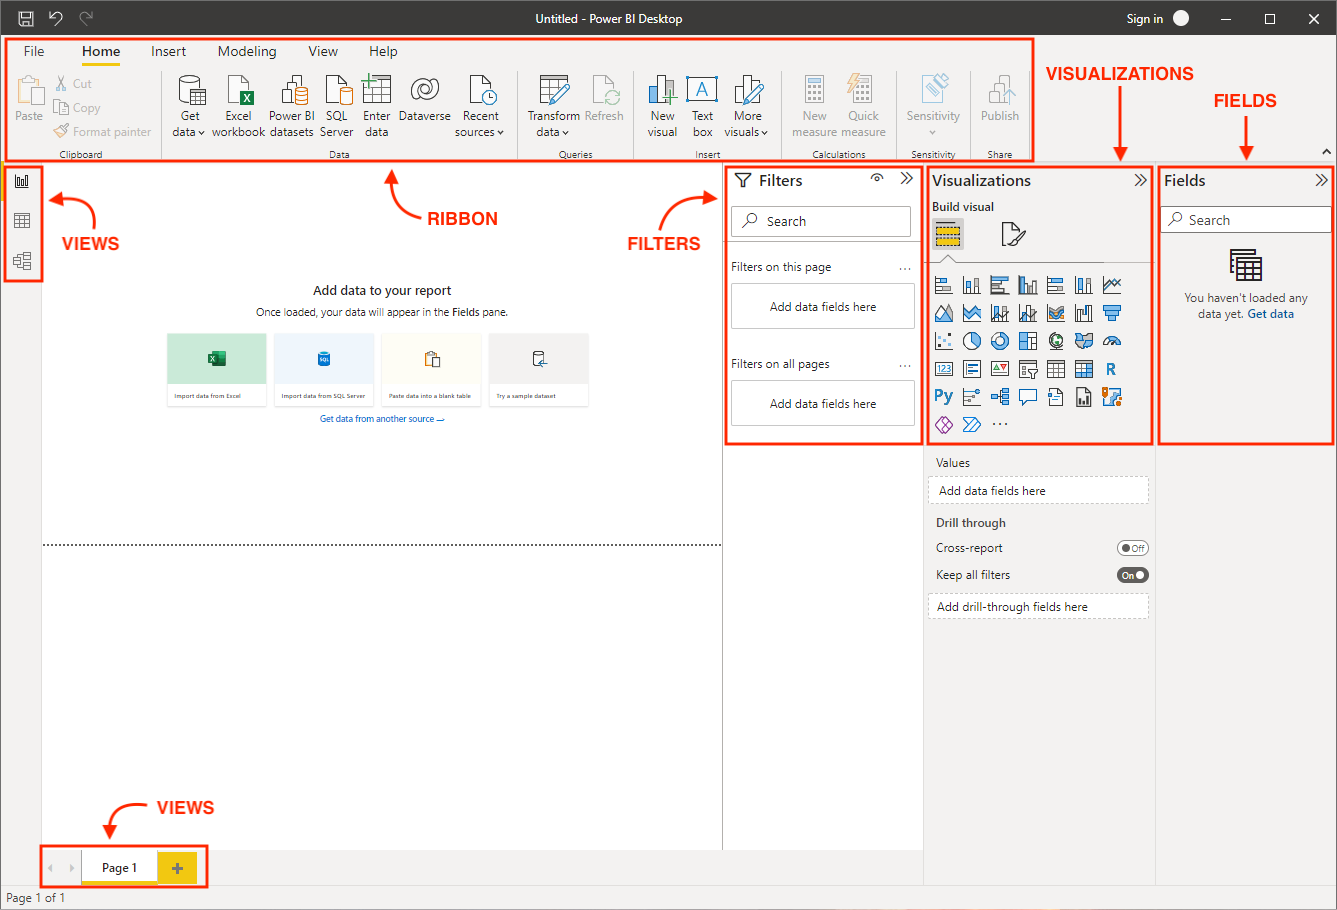
Before diving into more details, let's take a look at the components of Power BI Desktop:
- Ribbon: Located at the top and contains the controls and options needed for report creation.
- Views: Consists of three sections: Report view, Data view, and Model view.
- Canvas: The main design area where visualizations and other elements are added.
- Page Selector: Used to switch to other pages of the report.
- Filters: The section where fields are added to filter the data.
- Visualizations: The section where a list of available visualization types is displayed.
- Fields: Contains the tables and fields available in the data model.
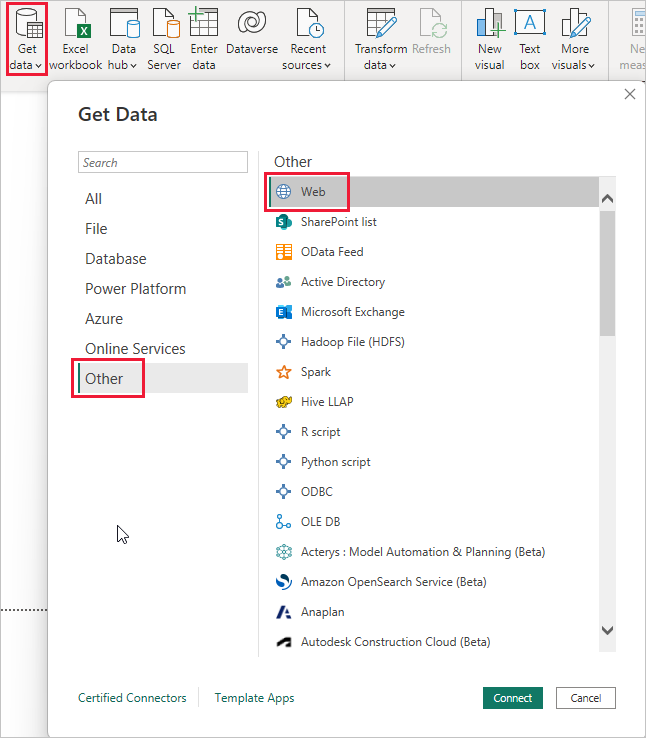
2. Importing Data
Power BI offers numerous supported data sources and connections, including SQL databases, web sources, and Excel.
To import data, click on the “Get Data” button in the “Home” tab.
If you are importing data from Excel, a preview window will open first. In this window, you can select tables or sheets.
Tables and sheets are shown with their respective icons. Here, it is usually more advantageous to import tables because they are organized with clear headers and row boundaries in Excel.
As another option, you can transform the data. It is usually more advantageous to transform the data before loading it. At this stage, you have the chance to correct minor errors or better organize the data.
When you select the "Transform Data" option, the Power Query Editor opens. Here, you can access the necessary tools to clean, transform, or optimize the data.
You can rename columns, change data types, sort data, and remove unnecessary rows or columns.
After completing the process, you should click “Close & Apply" to load the transformed data into Microsoft Power BI Desktop.
3. Creating Visualizations
Once the data is ready, you can start creating visualizations. Power BI offers various visualizations: bar charts, line charts, pie charts, tables, matrices, simple cards, KPIs, gauges, and interactive maps.
Let's see what the sections in the application do 👇
- Report View: This is the default view.
- Fields Pane: Displays the available data fields for your visualizations.
- Visualizations Pane: Allows you to select and customize different types of visualizations.
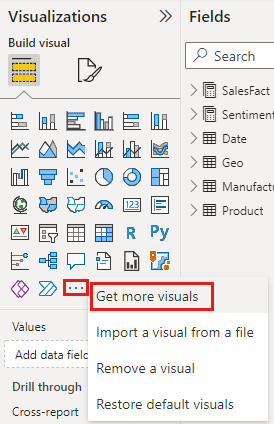
What if the visual I want is not on the list? 🤔 Power BI has a feature that allows you to import custom visualizations.
To do this, click on the three dots. A window (Microsoft AppSource) will open where you can browse all available visuals. From here, you can download custom visuals. If you have programming experience, you can even design your own visuals.
4. Filtering Data
In Power BI, you can apply filters to focus on specific data. To do this, hover over a field in the filters pane and click on the dropdown arrow icon. From here, you can select the desired filter type and criteria, such as showing the top 10 students.
5. Creating Reports
You can create detailed reports by adding different visualizations:
- 📊 Add Visuals: You can create various visuals like column charts, tables, and line charts by dragging fields into the design area.
- 🖌️ Format: You can style your visualizations by adding titles, labels, and colors using the formatting pane.
- 🗂️ Multiple Pages: You can add new report pages by clicking the + icon next to the existing pages.
6. Saving and Sharing Reports in Power BI
When your report is ready, you can publish it to the Power BI Workspace. To do this, select the “Publish” option on the side. Additionally, you can export the report as an Excel, PowerPoint, or PDF file.
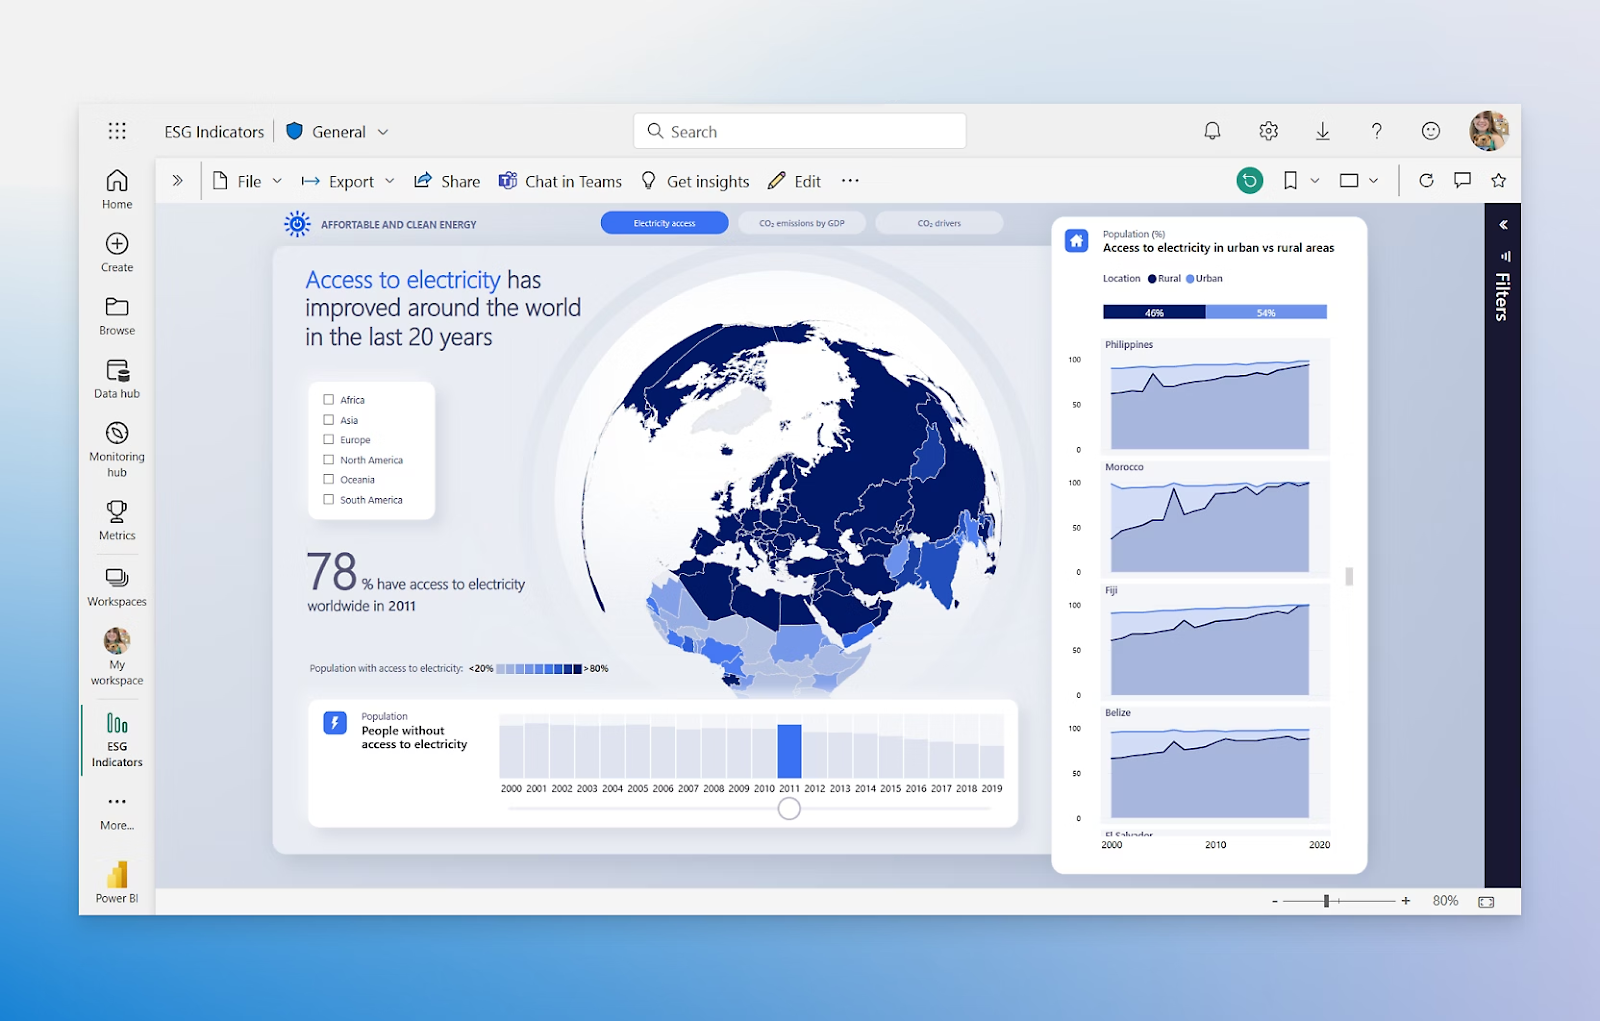
Power BI Dashboard
A Power BI dashboard is a visual representation that allows you to see a summary of your data at a glance. Power BI Dashboards are typically single-page. These pages allow users to see multiple visualizations simultaneously.
These dashboards are designed to display data in real-time or near real-time. They can connect to various data sources, including databases, cloud services, and streaming data, providing up-to-date information.
Although different visualizations can be used in dashboards, they primarily focus on tables, charts, gauges, and cards. These visual elements represent key performance indicators (KPIs) and provide a quick overview of business metrics.
Also, let's note that Power BI dashboards are quite different from Power BI reports. While reports can be multi-page, dashboards are single-page summaries.
Who Uses Power BI?
Power BI serves users across a wide range of industries, including healthcare, finance, retail, and manufacturing, from small businesses to global enterprises.
Its customers include Nestle, Adobe, and BP. All these companies use Power BI to centralize data, generate real-time insights, and make informed decisions.
Users of Power BI applications include business analysts, data analysts, data scientists and other professionals who need to analyze and visualize data.
Career in Power BI
As companies increasingly turn to business intelligence tools in their decision-making processes, Power BI skills are gaining great value for data-focused roles. The demand for Power BI developers and analysts is rapidly increasing.
You might be curious about common career options:
- Power BI Developer/Analyst: Focuses on creating and managing data models, dashboards, and reports.
- Power BI Consultant: Works with clients to implement and optimize Power BI solutions tailored to their business needs.
- Business Intelligence (BI) Roles: Covers broader roles that include Power BI alongside other tools like Tableau or SQL.
Power BI has become a universal platform used in nearly every sector. Specializing in this tool can significantly boost your career expectations. To enhance your Power BI and business analyst skills, you can check out our free meet-ups and bootcamps.
Summarize this content with artificial intelligence!


